Analytic Module
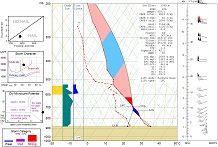
Severe Weather Screen Display.
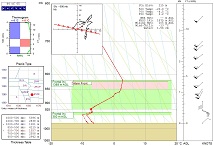
Winter Weather Screen Display.
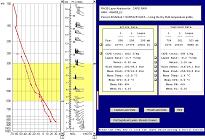
Layer Analyzer Screen Display.
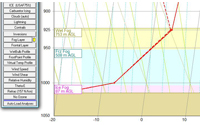
Fog layers example.
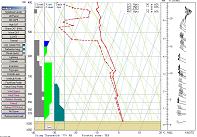
Cloud and Icing layers example.
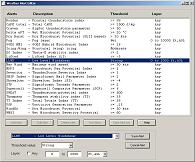
Weather Alert Table example.
Features
- Display unique Severe Weather (video), Winter Weather (video),
Fire/AQ Weather (video),
and Tropical Weather (video) specialty diagrams;
the new Hazards display, and the unique storm category and precipitation nomograms.
- Use the unique Layer Analyzer display to interrogate any sounding layer. See video
- Analyze the PBL (mixing height) layers with graphic display options. Display CAPE graphics. Select many CAPE options including MUCAPE.
- Graphically display 20 analytical parameters, including CAT, icing, LLWS, fog, fronts, inversions, and many more. Use convenient toolbar to arrange and display selected graphic options. Display additional parameters on widescreen monitors.
- Analyze & display over 100 key parameters and data indices, including the unique RPM severe weather metric. Print or file information using 7 different data listings and display formats:
- Summary Listing (columnar list
of key data for all data levels).
- Complete Listing (columnar list
of all data for all data levels).
- Interval Listing (user-specified pressure
intervals -- temp & wind data).
- Analyses Listing (detailed thermodynamic,
key data & layer information).
- Severe Weather Table (displays results
of user-defined weather categories).
- Indices Comparisons Table (compares
"unstable" options: "surface/mixed/most").
- CAPE Data Table (with user-selectable
CAPE layer interval).
- Use the advanced Planetary Boundary Layer (PBL) detection system to obtain valuable Mixing Height data.
- Use the unique Severe Weather Parameter table for storm potential analyses.
- Contains a Cloud data editor and provides manual or automatic cloud generation options. With precipitation on/off option to better define icing potential (see example).
- Compare 2 soundings in full detail or overlay up to 5 simultaneous soundings.
- Overlay unique Contrail Threshold and Height Correction reference lines.
- Import and Export sounding data.
- Import data from the Internet using URLs.
- Export data to text or spreadsheet files.
- Use Windows or DOS batch commands with the Batch & Timer control panels to automate data processing functions, including data download, image processing, data export, and merging functions.
- Fine tune FOGs with the Fog Layer Editor, or produce probabilities for Radiation and Advection fogs.
- Analyze "clouds" on the Soaring Screen and the optional Cross-Section Module.
- Use the Weather Alert Editor to display up to 24 customized alert messages, including CAPE, LI, fog, SWEAT, WindEx, Showalter, LLWS, STP, and many others. Alert options include visual, audible,
and email/text alerts. For each alert, a threshold value can be specified, while some alerts can also be restricted to specific layers -- such as LLWS.
See video. These alerts can also be activated when using the optional Real-Time Display module when automatically processing real-time cross-sections.
- If the Cross-Section module is purchased, then most of the analytical parameters that can be displayed on sounding diagrams can also be displayed on cross-section or time-section diagrams.


