Standard Vertical
Cross-Section Module

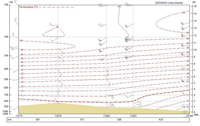
Example of a Vertical Cross-Section screen.

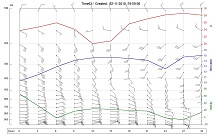
Example of Meteogram overlay analyses.

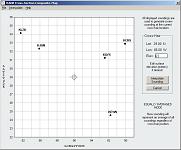
Example Composite Sounding Interpolation screen.
- Plot from 2 to 100 soundings on time-based or distance-based cross-sections.
- Cross-Section diagrams are fully configurable
including dual axes labels.
- Cross-Section datasets are easily modified with a
built-in editor.
- Ability to display a mini-sounding for each
cross-section sounding.
- Analyze cross-sections with a toolbar containing 47 data options.
- Each option can be individually configured for data interval, color, and line type.
- Line and font thickness options are also available.
- Automatically generate a complete interpolated sounding for any diagram location.
- Sounding temperatures and winds are interpolated.
- Special interpolation algorithms used for locations in sloping elevations.
- Soundings are automatically converted to WMO coded data level standards.
- Create unique Meteogram overlay analyses. Choose over 85 different parameters, such as CAPE, LI, SWEAT, WindEx, Helicity, Showalter, Hail size, and many more. Individually configure line color and size. The image to the right shows 3 Meteogram analyses on a time-section diagram. View a page from the User Manual on Meteogram analyses.
- Create composite soundings using up to 100 source soundings (example at right).
- Use the special Composite Sounding screen to identify location an elevation parameters.
- Potentially allows sounding interpolation for any world-wide location.
- Select from Distance-Weighted or Area-Averaged interpolation options.
- Quickly create distance or time-base diagrams. Click here for a description of how to
manually create a time-height diagram, or click this
link for faster automated
creation.


