Fronts and Forecast Module

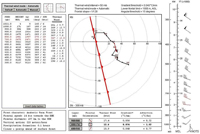
Example of a Frontal Analysis screen.

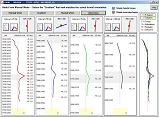
Example of a Manual Frontal Analysis screen.

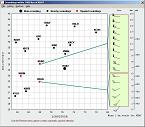
Example of a Sounding Forecasting screen.
Features
- Using only the plotted sounding's data , RAOB can produce the following (see video):
- A complete frontal analysis, including frontal movement and precipitation zones See video.
- Accurate short-term forecasts using the sounding's thermal wind data. See video.
- RAOB fully automates classic Single-Station-Analysis techniques.
- Use the Forecast toolbar to control all aspects of the forecast process:
- Apply forecast advections by 1-hour or 6-hour increments.
- Sequentially step forward and backward to study each increment.
- Use smoothing and advection options to control forecast processes.
- Save each forecast to file for later use.
- Use data files to create time-series cross-sections.
- Create forecasts using only the plotted sounding's wind data (video).
- Use the hodograph's thermal winds to modify the temperature profile.
- Allows surface data input to improve boundary-layer forecasts.
- Initialize surface temperature, dewpoint, and pressure data. See video.
- Create forecasts using nearby soundings that are upwind.
- Adjusts both sounding temperature and wind data.
- Use automatic or manual identification of upwind soundings.
- Specify the upwind range for automatic sounding selection.
- Forecast maximum surface temperatures using Gold's method along with user defined configuration options.
- Plot a Thermal Wind profile using the Sounding diagram's Toolbar during wide-screen analyses.


