Soundingram Module

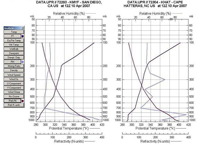
Example Soundingram with two soundings.

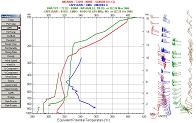
Example Soundingram with four soundings.

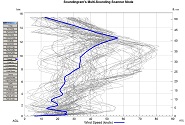
Example of a Scanner Diagram.
Features
- The Soundingram module let's you compare not only temperature and dewpoint profiles, but also 24 other key data, such as potential temperature, wind speed, precipitable water, ozone, CAPE, humidity, mixing ratio, refractivity, and many other parameters.
- RAOB's Soundingram is composed of ordinary X-Y graphs with orthogonal coordinates (similar to the Emagram sounding diagram). The Soundingram has an analysis toolbar (similar to other diagrams) which is used to select parameters for display.
- Use the Scanner display screen to visually inspect all soundings contained in a multi-sounding datafile.
- The user can choose displays using one to two diagrams in addition to selection of which parameters are displayed on each diagram. Additionally, two soundings can be plotted (on one or two diagrams) for detailed data comparisons. See the video.
- See the Advanced Soundingram module for additional features.


