Doppler (Lidar) Decoder/Display Module
Features

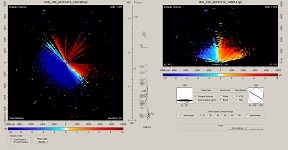
Example VAD, RHI, and Vertical Wind Profile display screen.
- The unique Doppler display screen can simultaneously plot 3 different lidar-based
images on one display: PPI (or VAD), RHI, and DBS (or vertical wind plots).
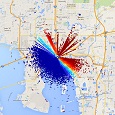
This display contains a complete set of interactive display options, including options to plot Doppler Velocity or Backscatter. This display can be fully automated with comprehensive Batch & Timer options. There is also an option to display a fader-controlled Map background image behind the VAD/PPI plot (as seen right). See demonstration video.

Map image example.
- Using the optional Advanced Cross-Section
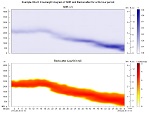
module, Time-Height diagrams can be created from the Lidar scan files. The below example shows dual time-height diagrams of SNR and Backscatter data.
- The Doppler module's decoders can process a variety of Lidar data files from the following manufacturers:
- Leosphere WindCube data:
- PPI, RHI, DBS, and FIXED time-series.
- HALO-Photonics Steam Line data:
- VAD, RHI, Wind-Profiles, and STARE time-series.

Example 2-panel Time-Height diagrams of SNR and Backscatter.


