Interactive &
Hodograph Module

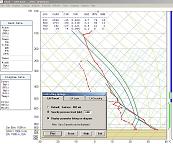
Example of a lifting multiple parcels.

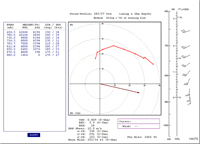
Example of the standard Hodograph diagram.

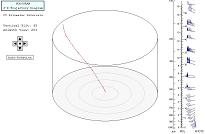
Example of a 3-D Hodogram display.
Features
- Graphically modify sounding data while text & graphic displays simultaneously update. See video.
- View key sounding parameters using
a unique graphic overlay system.
- Click & drag sounding profile
(temperature & dewpoint) data.
- Click & keystroke wind plot
(speed & direction) data.
- Fast point & click temperature
and wind data addition and removal.
- See video on how to make your own sounding.
- Zoom (in & out) on any portion of the sounding diagram's temperature profile.
- Flexible lifting options are available (see above example image). See video.
- View Sounding profiles and Hodograph plots with a unique Sequencer display. See video.
- View detailed Storm Table of shear, helicity and CAPE data. See video.
- Visually compare 2 hodographs on a single diagram.
- Color code Up/Down vertical motion on the hodograph diagram.
- Automatically mix the boundary layer with the dry adiabatic lapse rate (DALR) option.
- The expanded HODOGRAPH diagram can be seen at right. It is also fully interactive like the sounding diagram with click & drag wind vectors. The Hodograph diagram also offers a variety of additional display options not available with the Sounding's mini-Hodo plot. For example, this Hodograph image shows several display options including the ability to plot pressure data indicators with the hodograph vectors.
See the Bunkers
"steering flow" options.
- Full-screen, fully interactive click & drag Hodograph with full wind data text listing.
- Click & drag storm motion vector options.
- Plot helicity contours, using display options.
- Plot Ground & Storm relative wind vectors.
- Plot MBE (Corfidi) vector display.
- See video.
- Full-screen, 3-D Hodogram (trajectory diagram) with interactive tilt & rotation options. See the video for examples.
- With automatic continuous tilt & rotation viewing options.
- With a widescreen
monitor you can display additional graphic and text data.
- See
the Storm-Relative
Anvil-Layer Wind Circle display option.


