Advanced Vertical
Cross-Section Module

Example temperature analysis.

Gradient Editor.

Split Screen example.

Example 3-Panel Display.

Example 2-Panel Display.
Features
RAOB’s Advanced Cross-Section module contains all the features of the Standard Cross-Section module plus the following additional features. See video.
- 6,000 Soundings. Whereas the Standard Module has an upper limit of 100 soundings per cross-section, the Advanced Module allows up to 6,000 soundings per cross-section. This is especially useful for detailed studies of time-series sections where sounding data is produced by surface-based sounding systems with very high temporal resolutions.
- Colorizing. This option paints the first parameter selected for analysis with vivid colors (see video). Follow-on parameter analyses are displayed as overlaid isopleths. A built-in Gradient Editor (see image at right) provides a full-featured color gradient editing tool to customize diagram gradients. The lower-right image shows how RAOB can also display categorical parameters, such as CAPE, Icing, Turbulence, Fog Layers, Inversions and others.
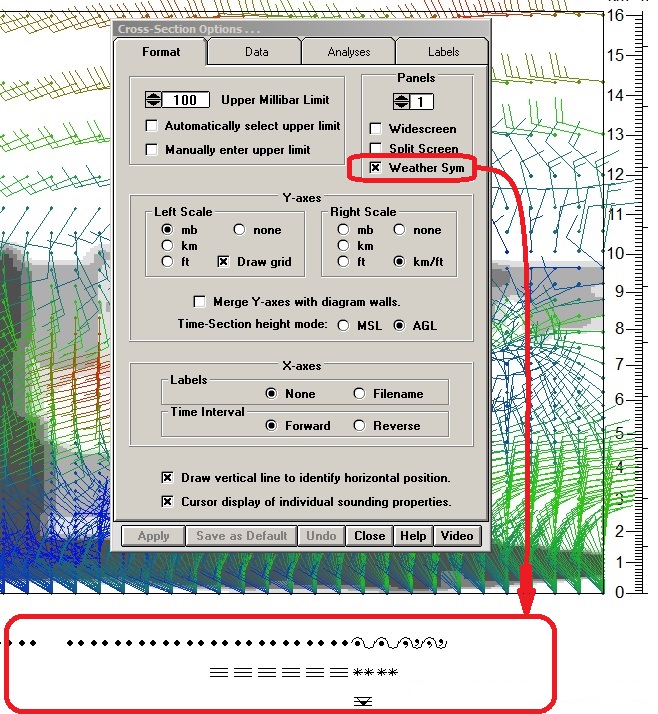
- Weather Symbols. Plot standard weather symbols below a sectional diagram. Option is only available when viewing a single-panel display.
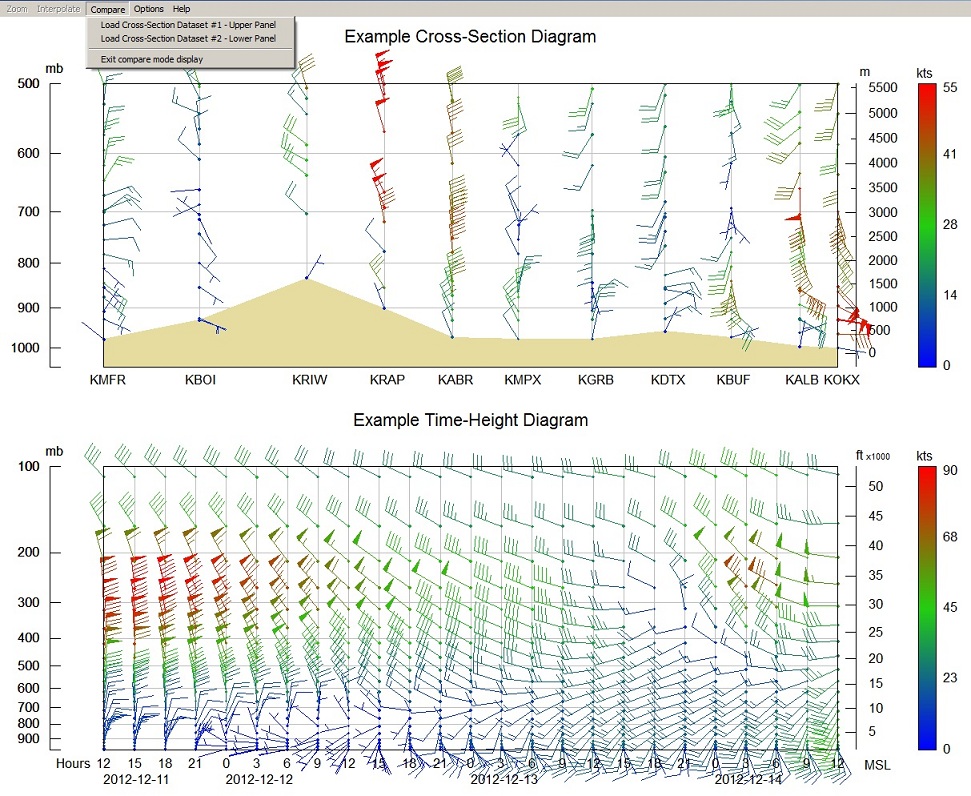
- Compare Mode. Simultaneously compare Cross-Section and/or Time-Height diagrams, where the diagrams can be independently configured.
- Multi-Panel Display. Options exist to display 2, 3, or 4 panel cross-diagrams on the same screen (see lower-right image). This allows easy comparison multiple parameter analyses on separate panels. Panels can be individually configured for wind displays.
- Split-Screen Display. Use this option to view both a Cross-Section (or Time-Height) diagram along with a Sounding (SkewT or Emagram) diagram on a wide-screen display screen. See below example image and video.
- Time-Height Diagram Batch Option. Use batch commands to activate RAOB, produce time-height diagrams, and automatically save and/or FTP image files.
- Zoom Option. Use to Zoom in/out on any section of a plotted diagram.
- Real-Time Option. Add the optional Real-Time Display module to enable automatic sounding file detection and updating of time-section diagrams. Great for monitoring high value interests.