High Altitude Module

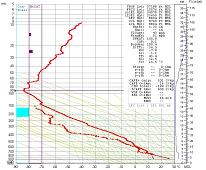
Example High Altitude sounding.
Features
- Plot sounding data above 100 mb and up to the 0.001 mb level (90 kilometers or 300,000 feet).
- High altitude processing is applied to all RAOB program modules, such as the Vertical Cross-Sections, Mountain-Wave, Soundingram, etc. All associated diagrams are configurable to the 0.001 mb level (90 kilometers or 300,000 feet) as all associated text and data listings reflect the additional height.
- See example Sounding diagram extend up to
0.001 mb (or about 90 Km).
- See example diagram of a
Mars sounding.
- This module is especially helpful for those interested in stratospheric analyses, or have a need to process ozone data, or other upper-level factors such as high-altitude turbulence. The displayed image shows the Tropopause with a horizontal purple line, and relative Ozone presence with the vertical blue line along the diagram's right margin. Contrail potential is shown by a light-blue bar along the diagram's left side. High-altitude turbulence is indicated by 2 purple bars alongside the Contrail indicator.
