The RAOB Custom View screen
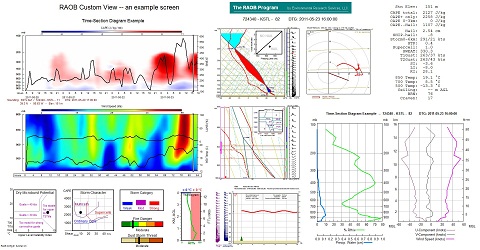
Select, position, re-size, and independently configure up to 20 panels on one screen. All panels are synchronized to the same sounding data.
You can now design your own RAOB display screen, regardless of screen size or orientation (horizontal or vertical). The below example contains 20 panel images using a widescreen monitor. Two panels are even embedded within other panels. Note the Hail / No-Hail image is placed within the top Sounding panel while the Precip-Type image is within the lower Sounding panel. Additionally, the Parameter Listing, which is typically located in the upper-right corner of the Sounding image is now displayed in a separate panel, located at the upper-right portion of the example screen. The panel displays and configuration options are infinite -- limited only by your imagination. Just select "Custom View" from the Displays menu and create the custom view that meets your needs. See video.
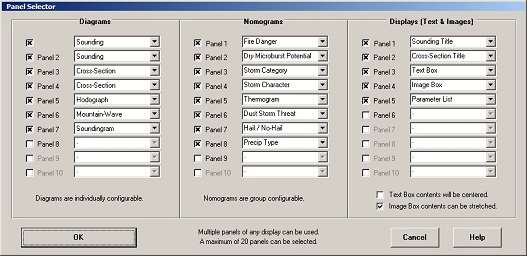
The Custom View display screen allows up to 20 panels. You can have any combination of panels, even 20 Sounding images, where each can be independently configured. The only requirement is selection of at least one Diagram panel, such as a Sounding or Cross-Section diagram. See the below image for the Panel Selector options used for the creation of the above Custom View screen. Note that this example contains 2 Sounding panels and 2 Cross-Section panels, and 16 other panel selections. The Displays (Text & Images) panel options even offer blank panels, which allow free form Text entry or display of any customer provided images.
A key advantage of the Custom View screen is that all panels are synchronized to the same sounding data. There are 2 types of data synchronization modes:
Data Synchronization Modes:
- Mode 1
- Sounding Data. When a sounding file is loaded, all panels will display data from the same sounding file. All graphic and text panels will display their respective images and data. A Cross-Section panel should not be included with this display mode.
- Mode 2
- Cross-Section Data. When a cross-section file is loaded, the Cross-Section panels will display the same sectional data, while all the Sounding-related panels (such Hodograph and Mountain-Wave) will display the individual sounding profile as selected from the Cross-Section display. Individual sounding profiles are selected from the Cross-Section images by using either a mouse click, the movie-loop controller, or the keyboard cursor keys. The above Custom View example employs this mode of data synchronization.
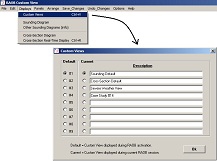
Use the Panels and Arrange menu options (shown below) design your custom view. The Panels menu displays the "Panel Selector" as shown in the above image.

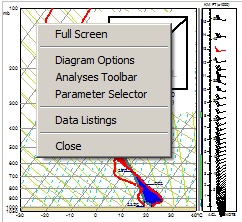
You may ask that with all the different kinds of diagrams and images, "how are the diagram and related configuration options handled?" Each panel contains its own unique menu. The menus are accessed simply by clicking on the image. A left-click presents the main popup menu (as shown below), while for the more involved diagrams (such as the Sounding and Cross-Section images), a right-click produces the same unique menuing action as experienced on the full screen version of the panels. You'll note that the top-most popup menu option always lists the "Full Screen" option, which when selected, automatically transfers the user to the diagrams home display screen.
Some diagram interactive features, such as the Sounding's "click & drag" functions are not available with the Custom View. However, full diagram interactive functionality is quickly available just by clicking on the "Full Screen" menu option.
Other data control options will appear when hovering the mouse over the panel of interest.
There's more. You can save up to 9 different display configurations for instant recall. Just use the "Custom Views" menu option as shown below.
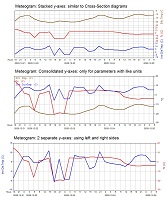
And that's not all. The one diagram option not shown above the is the new Super-Meteogram display. It not only provides the standard meteogram graphs, but it is also fully user configurable and provides three Y-Axis display modes as shown below.
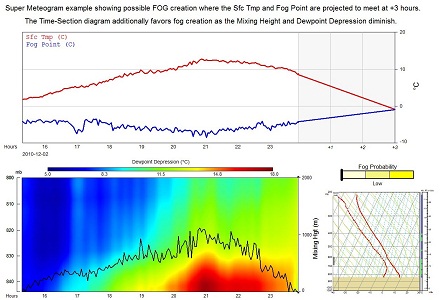
Additionally, the Super-Meteogram offers a one-of-a-kind data projection (extrapolation) function which provides short-term parameter forecasts out to 3 hours. Note that these projections only work for time-series sounding data, and they are only intended to be used with "real-time" sounding data produced by the non-conventional sounding profilers: microwave / laser / radar / acoustic. The below Custom View example contains the Super-Meteogram, a Time-Series Cross-Section, a Sounding diagram, and a Fog index display
