Basic Program

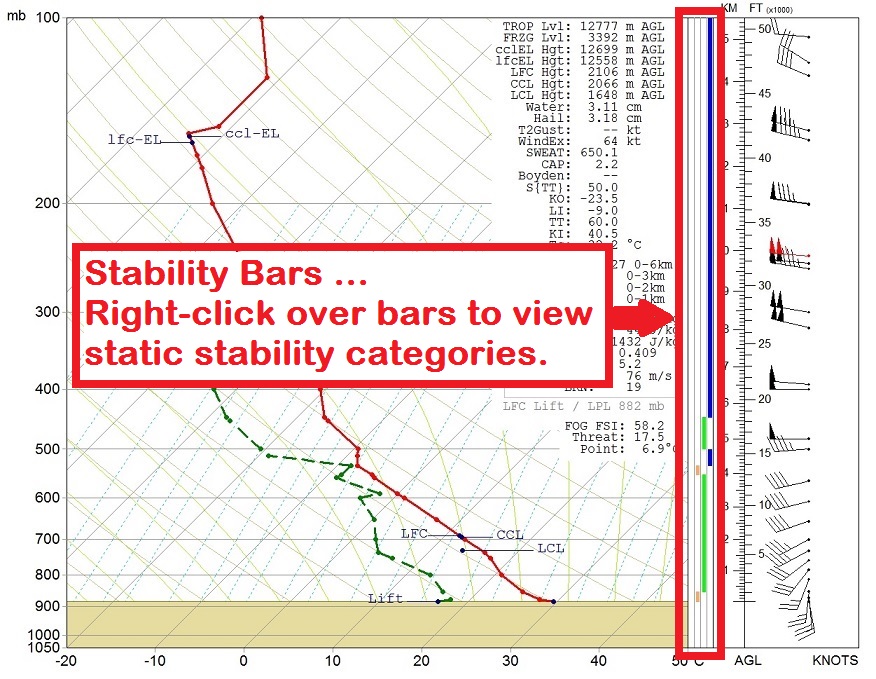
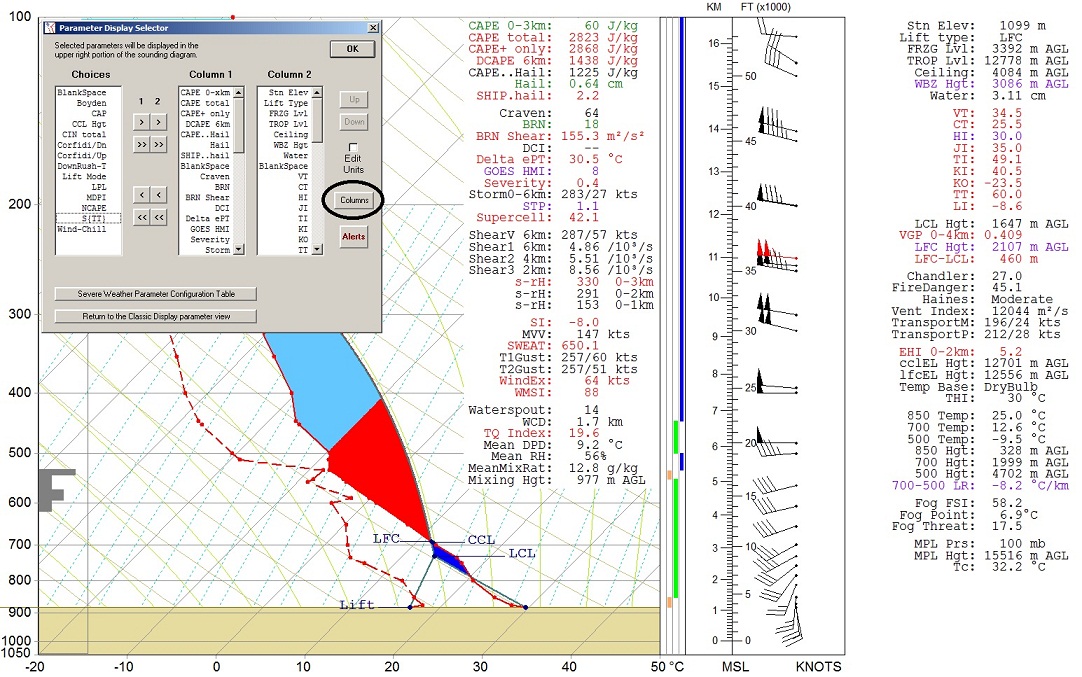
Example of a Skew-T Diagram.

Example of a Scanner Diagram.

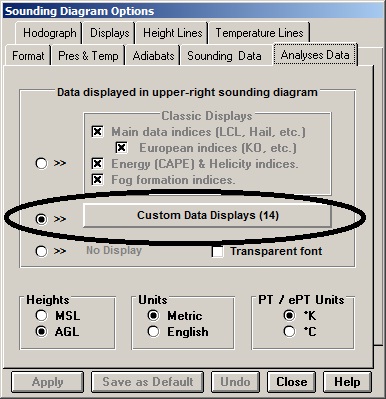
Sounding Diagram Options.

Example of a Soaring Diagram.
Features
- Skew-T, Emagram and Tephigram sounding diagrams up to the 100 mb (hPa) level. Overlay a configurable mini-hodograph and a configurable variety of sounding and stability parameters, including Static Stability. See a video of diagram options.
- Decode & process 5 different data formats (including WMO Coded data, UWYO, BUFKIT, SHARP, and RAOB CSV data). WMO Ship and Dropsonde data can also be processed. The RAOB CSV data format is a universal format allowing processing of any sounding data. Plot high-density soundings (containing over 10,000 data levels).
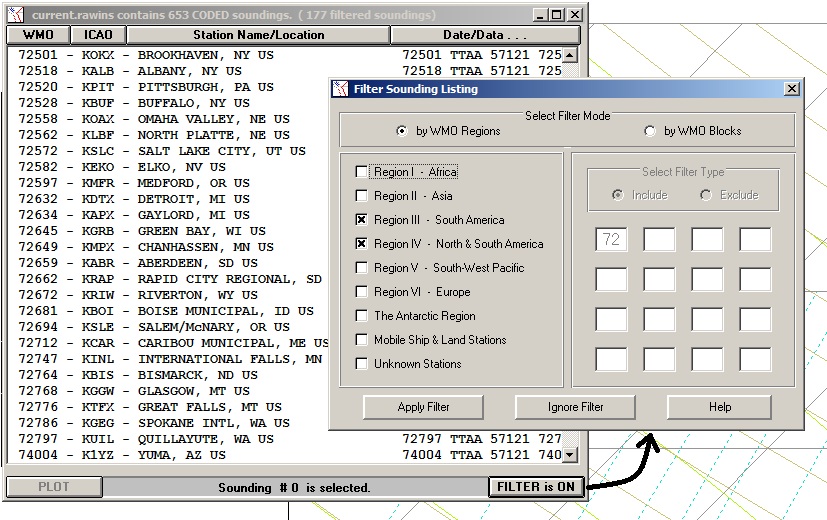
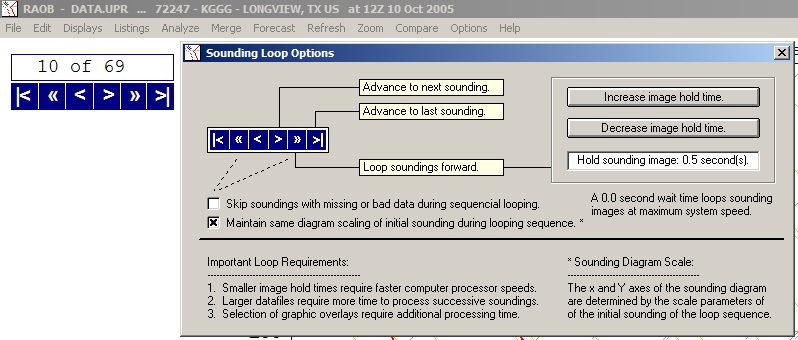
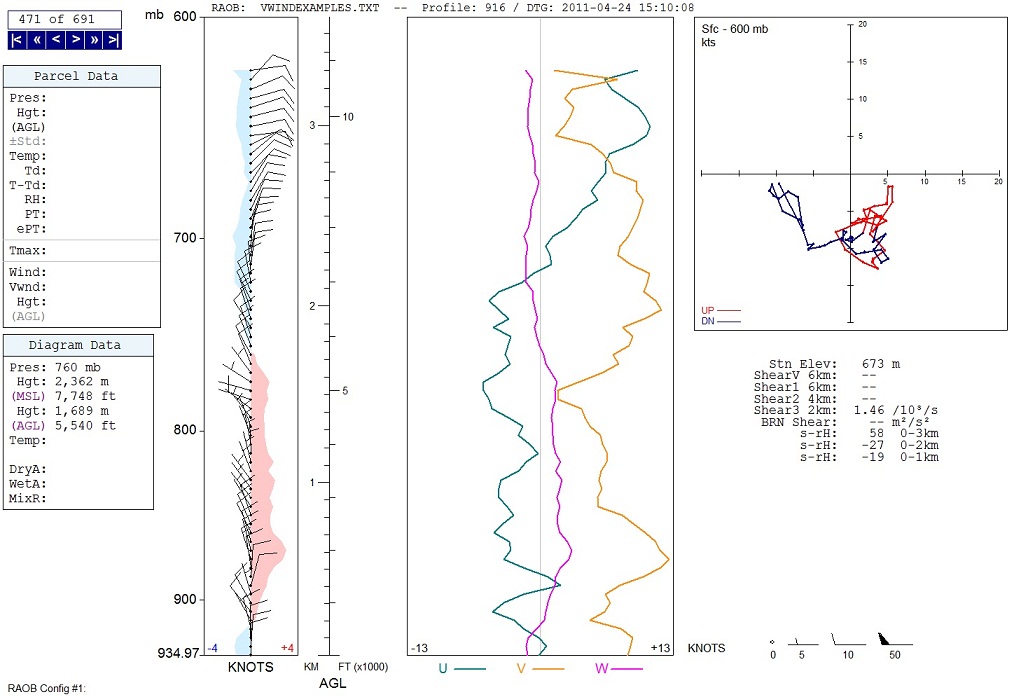
- Easily process data files containing multiple soundings. Quickly find soundings with the filter option. Sequence viewing with the variable loop (movie) display feature, or view them all on the Scanner (video) display screen, or compare UVW wind components on a unique display screen.
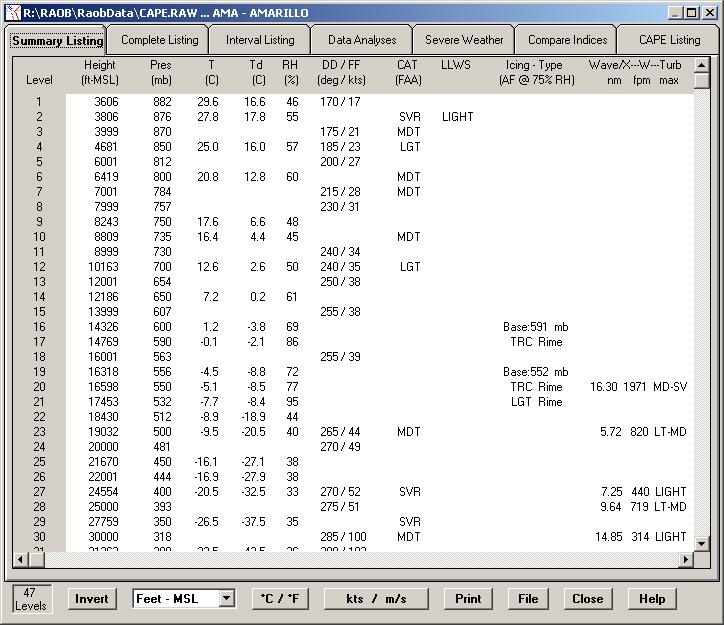
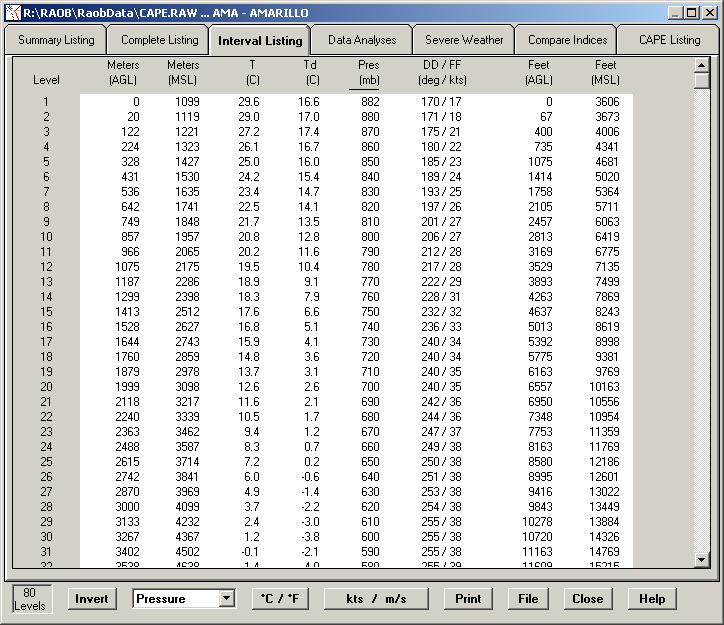
- Analyze & display numerous sounding parameters & indices. Print or file information using 2 different data listings & display formats:
- Has complete thermodynamic & storm indices calculations & displays. Graphically display basic sounding parameters (LCL, LFC, CCL, etc.). You can even list 2 separate columns of data parameters for those with wider screens.
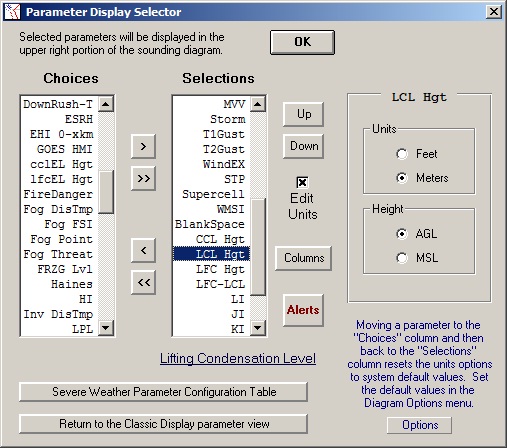
- Use the Diagram Options screen (at right) to select from over 140 options. Customize your diagram with scaling, griding, color, and labeling options. You can also customize the Skew-T data listing from options on the Analyses tab, which will activate the Parameter Display Selector.
- Contains "source" and "raw" data editors for complete data editing flexibility. Filter high-density soundings to "standard" data levels. Also contains a convenient Station Locator file editor.
- Use a full-screen Soaring screen display for sailplane and hang-glider lift parameters. Quickly identifies Thermal Index, Trigger Temps, and key lift estimates. A video tutorial is available for this display.
- In addition to RAOB's extensive online Help Files, an optional User Manual is available.