RAOB Displays
and Parameters
The complete list of RAOB indices,
analysis parameters, and graphic displays.
Display Options
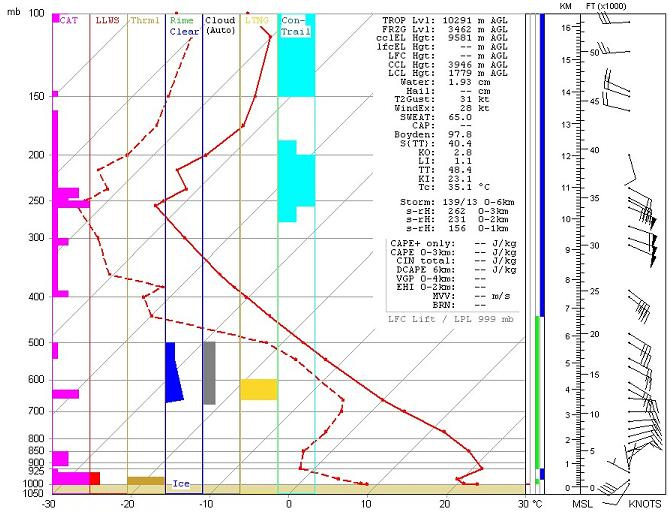
- Skew-T / Emagram / Tephigram
- Zoom & Un-Zoom
- Sounding comparison & overlays (overlay up to 5 soundings)
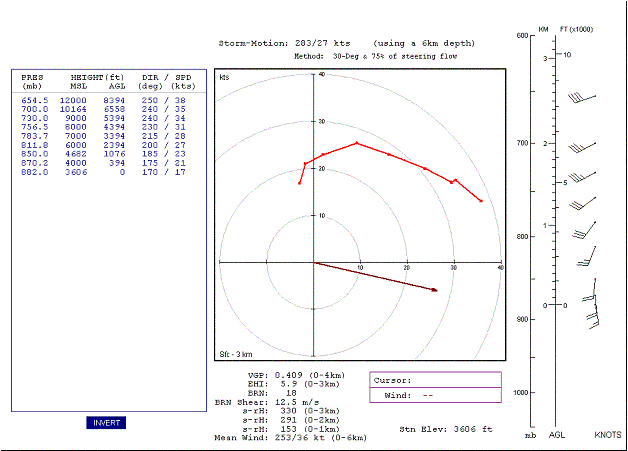
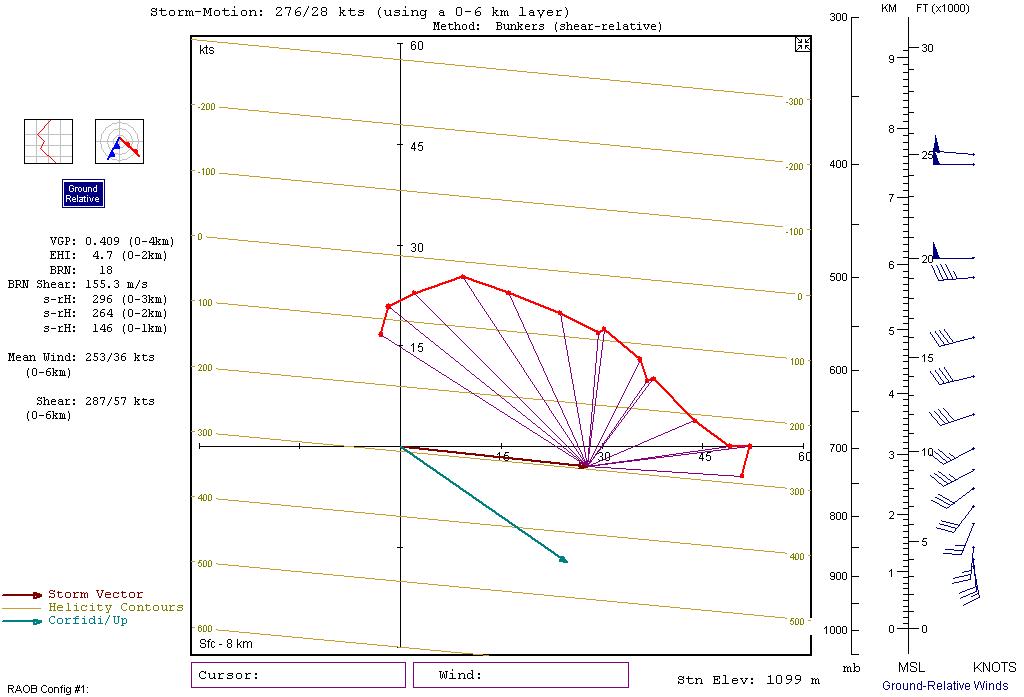
- Hodograph (vector winds)
- Including Ground & Storm vectors, MBE vector, and Helicity contours
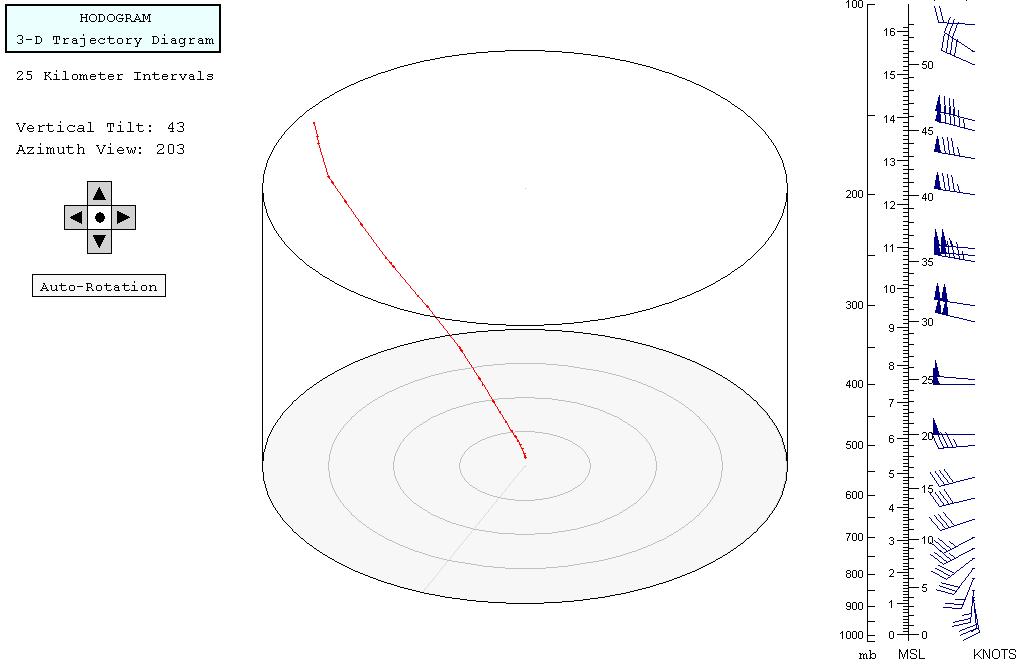
- Hodogram (3-Dimensional diagram trajectories)
- Hazards display view
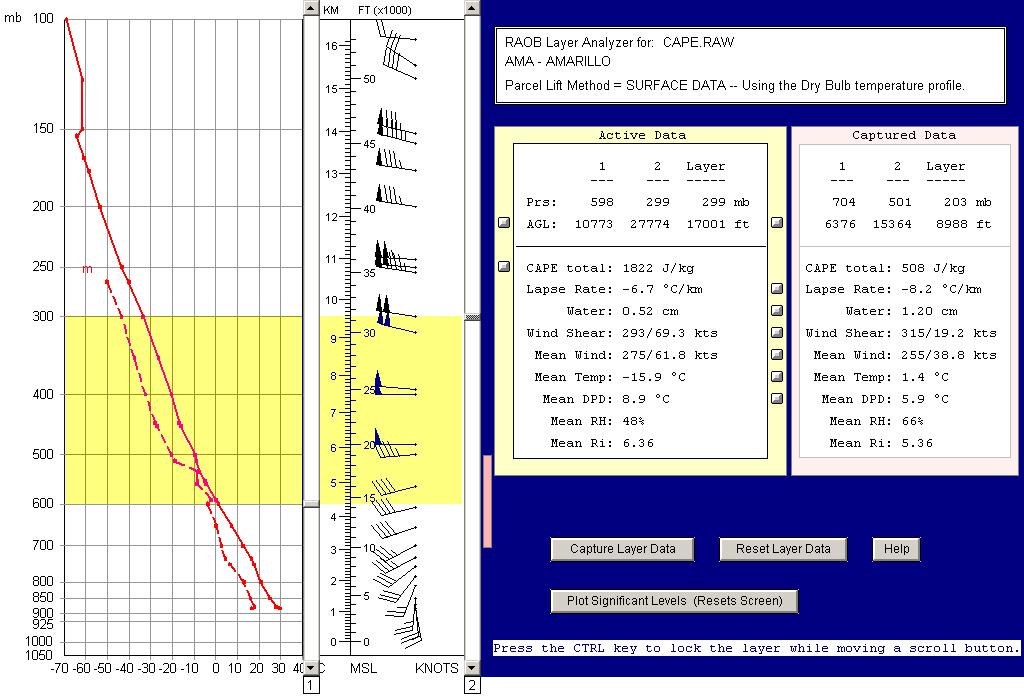
- Layer-Analyzer screen
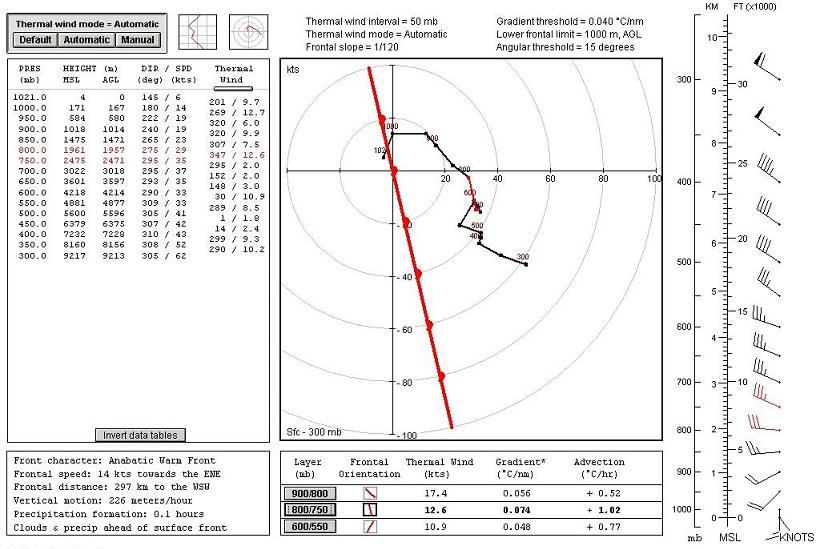
- Frontal Analysis screen
- Soundingram screen (detailed x-y diagram comparisons)
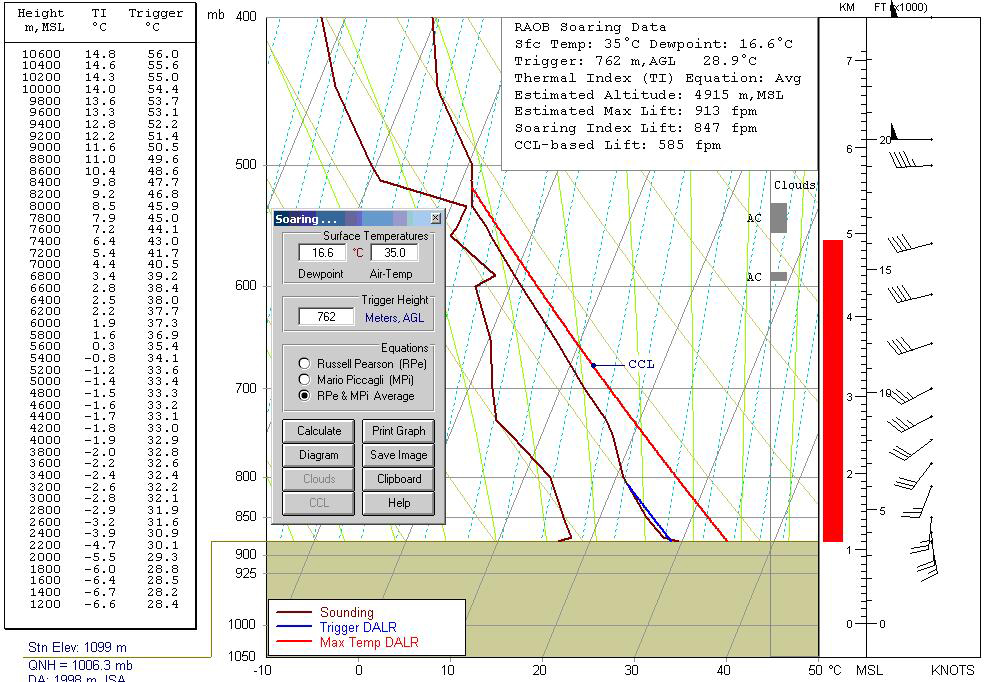
- Soaring display screen
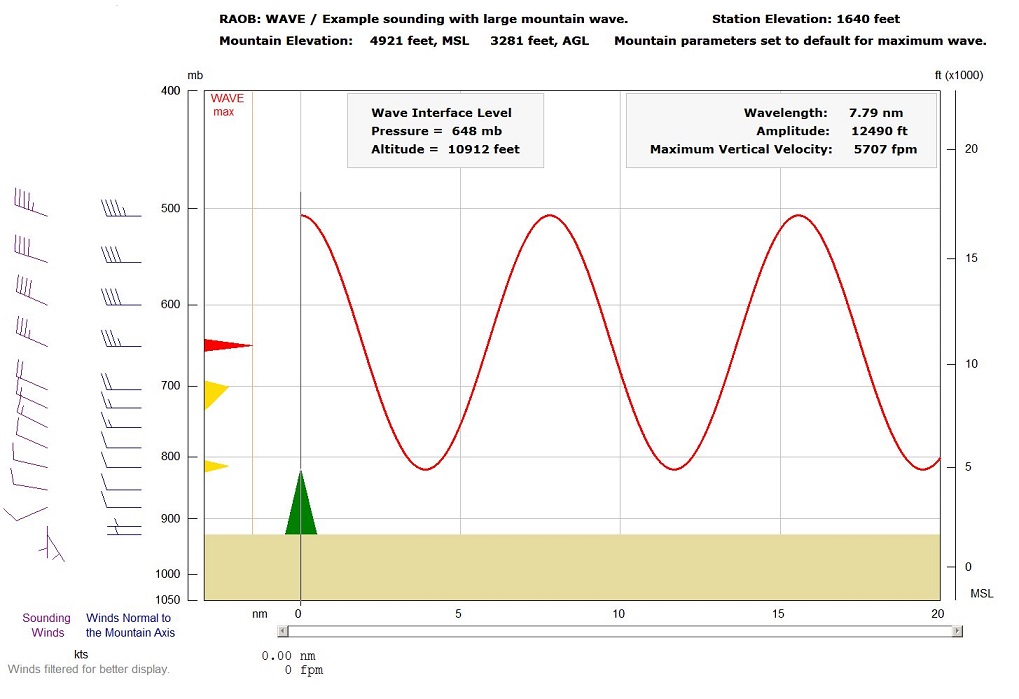
- Mountain-Wave screen
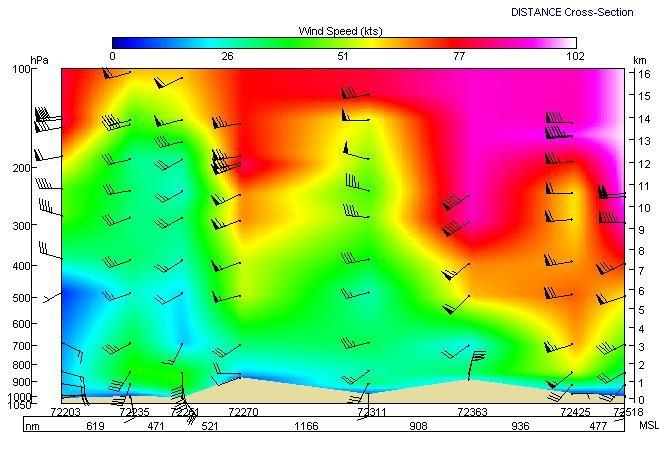
- Vertical Cross-Section screen
- Analyze up to 2,000 soundings per cross-section
- Including ability to interpolate complete sounding profiles
- Create composite soundings from up to 2,000 source soundings
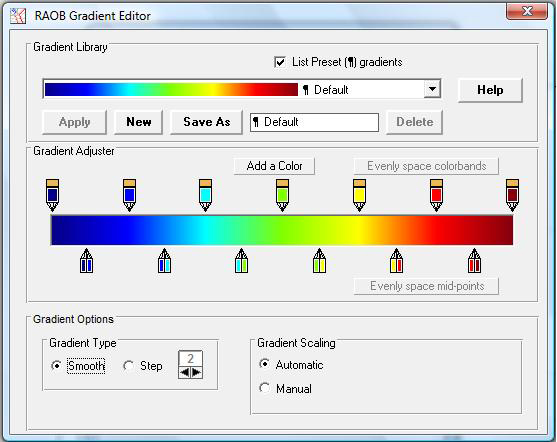
- Includes full-featured Gradient Editor
- Includes real-time data processing
- Plot up to 35 meteograms on cross-section
- Forecast Mode: Produce reliable short-term sounding forecasts
- Uses classic "single-station-analysis" techniques
- Automates advection of nearby upwind soundings
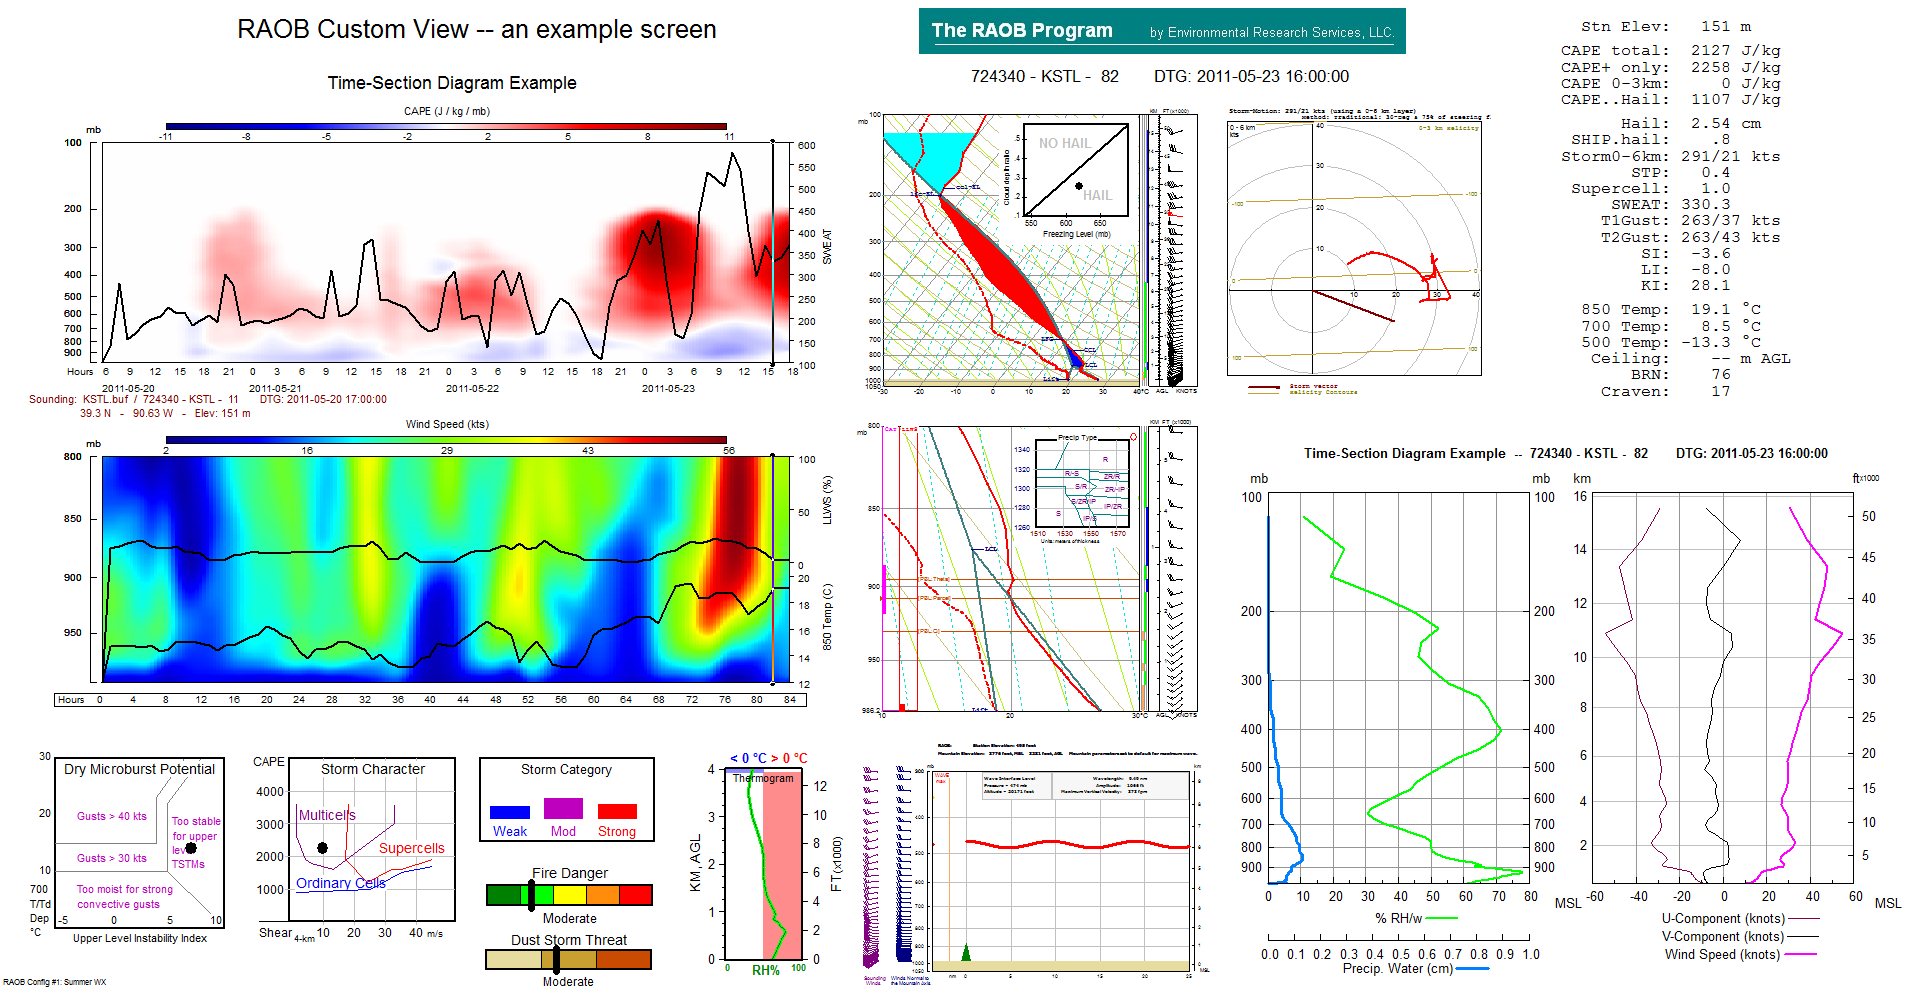
- Custom View Screen
- Customize up to 20 panels of images on one screen.
- Independently configure up to 9 different custom screens.
Data Encoders
- BUFKIT (includes CFRL data).
- BUFR (binary data).
- netCDF (binary data).
- RAOB Raw & CSV formats.
- WMO (TTAA, TTBB, etc).
- GSD/FSL.
- STANAG/NATO.
- Google Earth (kml file).
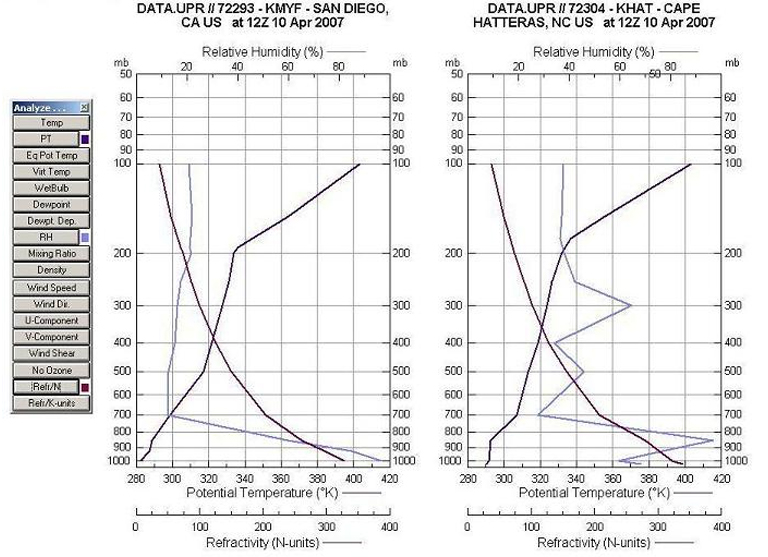
Sounding Profiles
- Temperature & Dewpoint
- Wet-Bulb & Virtual & Frost Point profiles
- A user-selectable "Reference" sounding
- Ozone and Omega data
- Potential & Equivalent potential temperature
- Relative Humidity, Mixing ratio and Density
- Wind speed and wind direction (with U & V components)
- Wind shear
- Refractivity (N & K units)
- CAPE, Richardson Index and Lyra-Scorer parameters
- Liquid Water & Vapor Density (radiometer data)
Lifting Functions
- Lift any parcel (lift & overlay up to 9 parcels)
- Lift any layer within the sounding (upward or downward)
- Lift (up or down) the entire sounding (simulates terrain lifting)
- Automatically mix the surface layer adiabatically (T & Td)
Reference Lines
- Lifted Parcel trace
- User-defined Reference sounding
- Height correction line
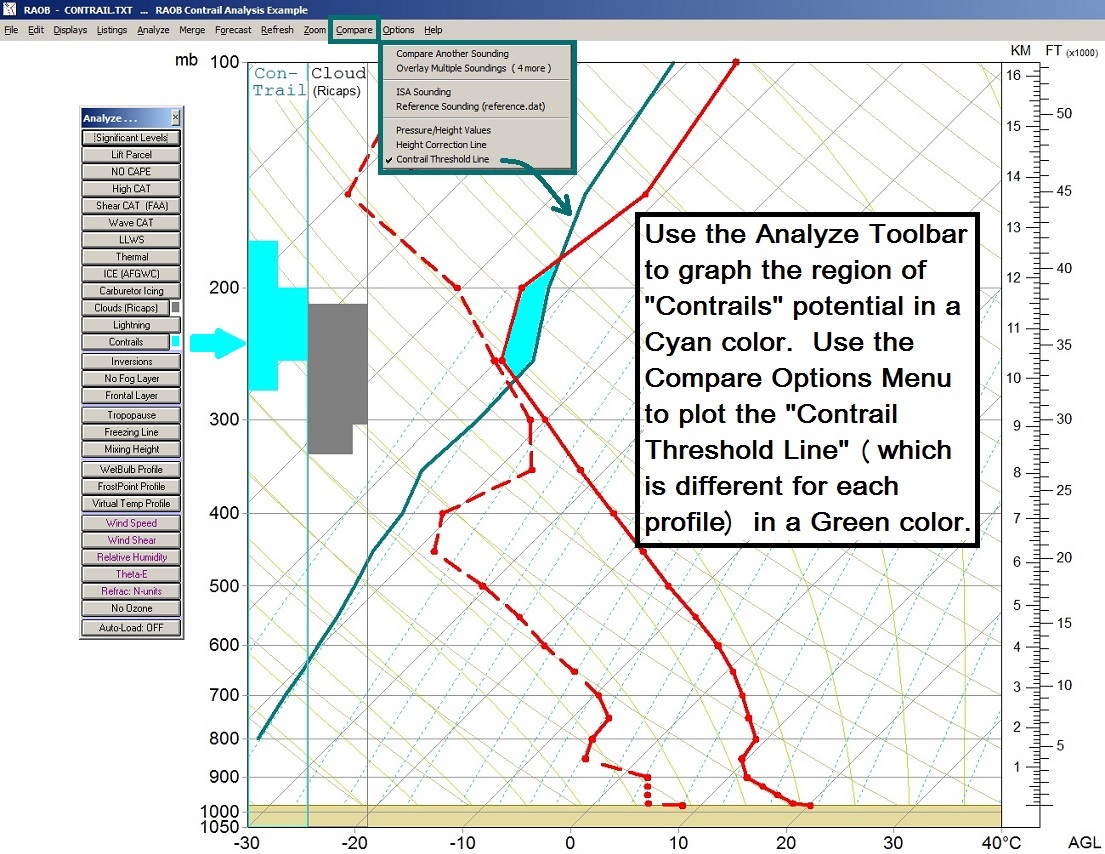
- Contrail threshold line
- Surface elevation line (with data)
- Freezing level line (plus text)
- Tropopause level line (plus text) (identifies up to 3 tropopauses)
- Height labels option for Pressure lines
- Height scale (kilometers)
- Height scale (feet or miles)
- Stability Bars (lapse rate categories)
- The international WMO ICAO standard reference atmosphere
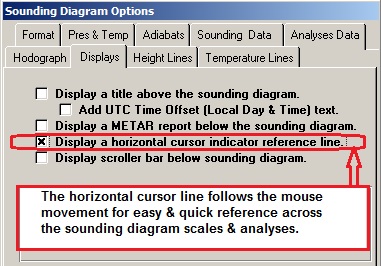
- Horizontal cursor reference line
Algorithm Processing Options
- CAPE Base Level: LFC or CCL
- CAPE Temperature Base: Dry Bulb Temp or Virtual Temp
- CAT: FAA and USAF methods
- Clouds: Automatic or manual generation
- DCAPE: Select from 3 algorithm options
- Desert High-Plains: Mode option
- Ducting/Trapping: Threshold specification
- Effective Storm-Relative Helicity (EFCTV srH) mode
- EHI Layer: Depth option
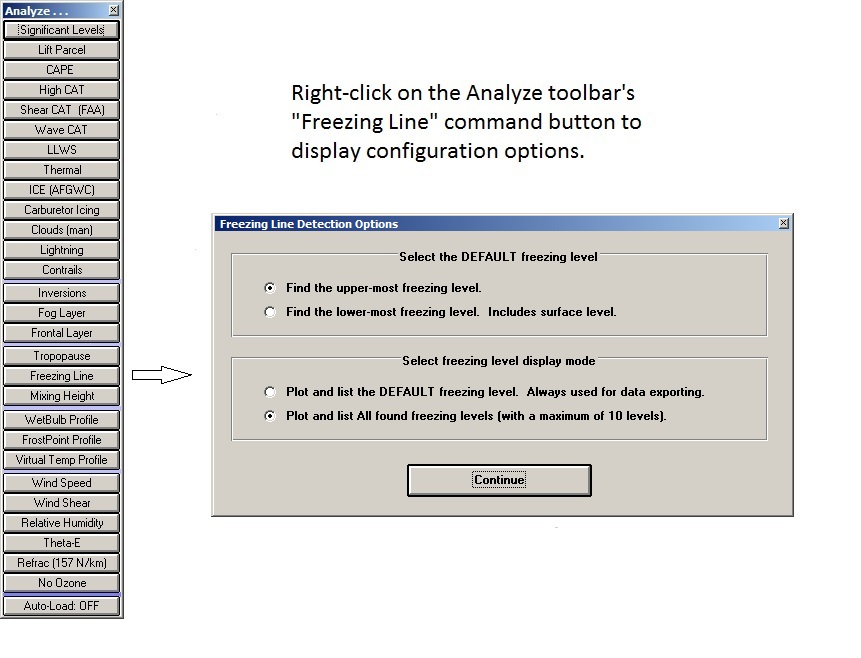
- Freezing level detection: upper or lower focus
- Icing: Smith-Feddes, AFGWC, and USAF methods
- Icing Detection Threshold: Relative humidity option
- Inversion Threshold criteria: Depth and lapse rate
- NOAA GSD Data: Allow automatic surface level calculations
- Parcel Lifting: Mean Lower Layer - depth option
- Parcel Lifting: Most Unstable mode - depth option
- PBL / Mixing Height
- Saturation Vapor Pressure: wrt Water only or Water & Ice
- Storm Motion Prediction: Tradition and Bunkers
- Ventilation Index: Numeric or category displays
- VGP Layer: Depth option
- Wind Shear Layer: Depth option
Sounding Analyses
- 700-500 mb lapse rate
- Boyden Index (European)
- BRN Shear
- Bulk Richardson Number (BRN)
- CAP (or Lid index)
- CAPE (total atmosphere)
- CAPE (lower layer – user defined)
- CAPE-Hail growth region
- CAPE with Virtual (Tv) Corrections
- Chandler Burning Index (CBI)
- Convective Inhibition (CIN)
- Convective Condensation Level (CCL)
- Convective temperature (Tc)
- Craven SigSvr Parameter
- Cross Totals (CT)
- DCAPE (Downdraft CAPE)
- Deep Convective Index (DCI)
- Delta Theta-E
- Downrush Surface Temperature
- Effective Storm-Relative Helicity (srH)
- Energy Helicity Index (EHI)
- Equilibrium Level (CCL based and LFC based)
- Fire Danger Index (FDI)
- Flash Flood Index
- Fog Dissipation Temperature
- Fog Layers (ice, freezing, wet)
- Fog Stability Index (FSI), Fog Threat, Fog Point
- Freezing Level
- Frontal Layers (warm, cold)
- GOES HMI (microburst index)
- Hail Size potential
- Haines Index (for fire potential)
- Heat Burst Index (rare Dry Microburst event)
- Humidity Index
- Inversion Dissipation Temperature
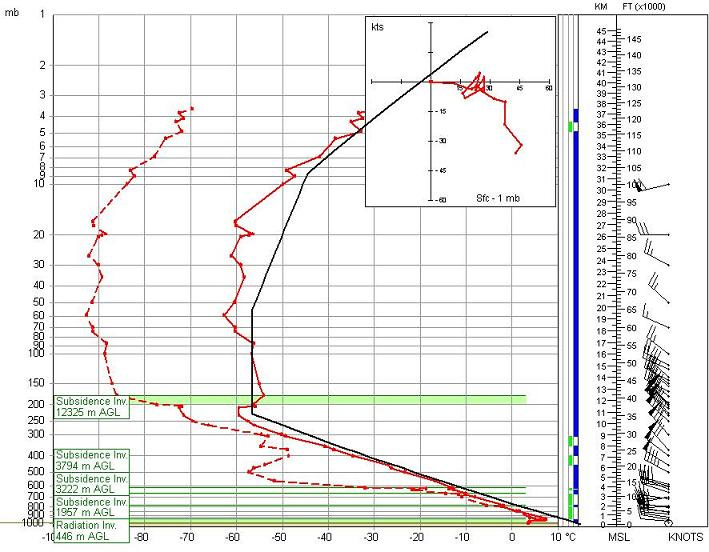
- Inversion Layers (radiation, subsidence, frontal)
- Jefferson index (JI)
- K-index (KI)
- KO Index (European)
- Lifted index (LI)
- Level of Free Convection (LFC)
- Lifted Condensation Level (LCL)
- Lifted Parcel Level (LPL)
- Maximum Parcel Level (MPL)
- Maximum Vertical Velocity (MVV)
- Mean Mixing Ratio (lower 100 mb)
- Mean winds (0-500 m)
- Mean winds (0-6 km)
- Microburst-Day Potential Index (MDPI)
- Mixing Height (PBL)
- NCAPE (normalized Cape)
- PBL / Mixing Height
- Pollution Potential
- Precipitable Water
- RPM (Raob Parameter Metric)
- S-index (European thunderstorm index)
- Showalter index (SI)
- Significant Hail Parameter (SHIP)
- Significant Tornado Parameter (STP)
- Supercell Composite Parameter (SCP)
- Surface-900mb Mean Wetbulb Theta
- Surface Downrush Temperature
- Surface QNH
- SWEAT index
- T1 and T2 Gust potential
- TCTP~UNC (Tropical Cyclone Tornado Parameter from Univ of NC at Charlotte)
- Temperature Humidity Index (THI)
- Thompson index (TI)
- Thunderstorm Severity Index (TSI)
- Tornado~TC Index
- Total Totals (TT)
- TQ Index
- Transport Wind Vector
- Tropopauses (3)
- Ventilation Index (for air pollution)
- Vertical Totals (VT)
- Violent Tornado Parameter (VTP)
- Vorticity Generation Parameter (VGP)
- Warm Cloud Depth (WCD)
- Water (total within column)
- Waterspout Index
- Wet Bulb Zero (WBZ) height
- Wind Chill Index
- Windex Gust potential
- WMSI (wet microburst severity index)
Hodograph Analyses
- Corfidi Upshear and Downshear vectors
- Ground-relative & Storm-relative vectors
- MBE: Meso-Beta scale Element (Corfidi) vector
- Plot right-moving & left-moving storm vectors
- Storm motion vectors (click & drag interactive)
- Traditional (user-configurable) storm motion
- Bunkers storm motion
- Storm-relative Helicity (0-3 km)
- Storm-relative Helicity (0-2 km)
- Storm-relative Helicity (0-1 km)
Cross-Section Analyses
- CAPE
- CAT and Hi-CAT
- Clouds
- Contrails
- Cross-Wind speed
- D-Values
- Density
- Dewpoint depression
- Equivalent potential temperature
- Icing (Structural & Carburetor)
- Liquid Water Content
- Liquid-water & Vapor-density (microwave data)
- Lightning
- Mixing Ratio
- Ozone
- Potential temperature
- Precipitable Water
- Refractivity & Ducting
- Refractivity (N & K units)
- Relative Humidity
- Significant pressure levels (100, 200, 300, 400, etc.) mb levels
- Temperature
- Tropopause, CCL, LFC, and LCL levels
- U-component wind speed
- V-component wind speed
- Wet-bulb temperature
- Wind speed
Mountain (lee) Wave Analyses
- Analyzes turbulence for any atmosphere
- Lee wave turbulence categories
Thickness Layers
- 1000 – 500 mb plus lapse rate
- 1000 – 700 mb plus lapse rate
- 1000 – 850 mb plus lapse rate
- 850 – 500 mb plus lapse rate
- 850 – 700 mb plus lapse rate
- 700 – 500 mb plus lapse rate
- 600 – 400 mb plus lapse rate
Data Level Analyses
- Brunt-Vaisala Frequency (wet) [N]
- CAT type & probability
- Clouds type & coverage
- Contrail potential
- Contrail critical temperature
- D-Value
- Density
- Density Altitude
- Dewpoint depression
- Equivalent potential temperature (ePT)
- High level CAT type
- High level CAT mixing-layer data
- High level CAT S-layer data
- Icing type & probability
- Inversion type, height, depth
- Lightning potential
- Liquid water content
- Low level wind shear (LLWS)
- Mixing ratio
- Potential temperature (PT)
- Richardson index (Ri)
- Refractivity (N-units)
- Refractivity (K-units)
- Relative humidity (RH)
- Theta-e/ice
- Vertical stability factor (gB)
- Vertical wind shear
- Virtual Potential Temperature
Summary Displays
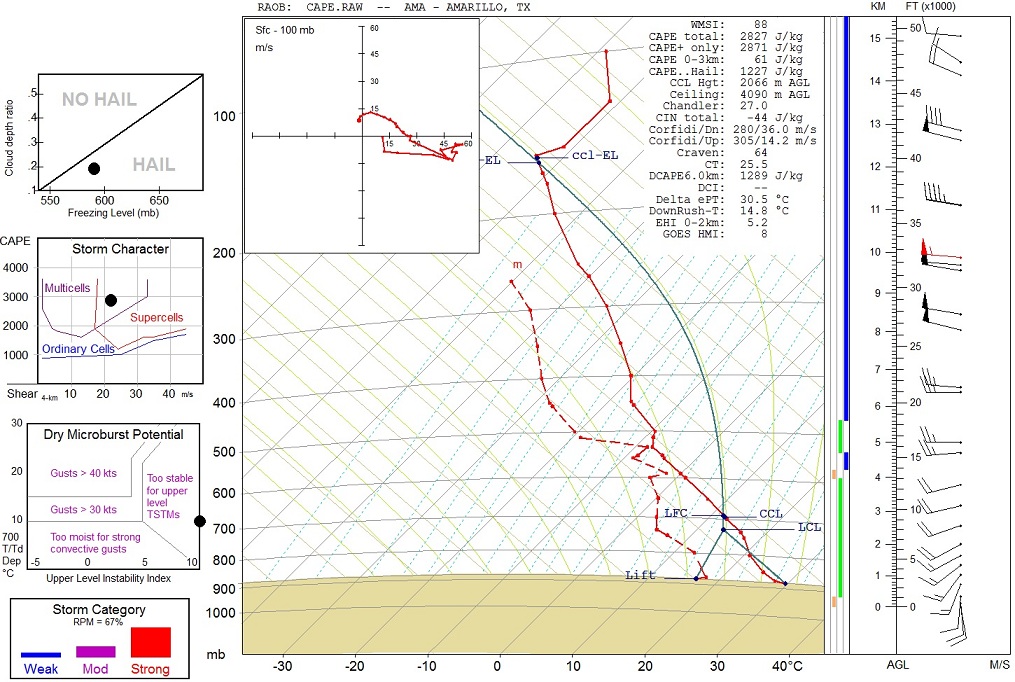
- Dry Microburst nomogram
- Precipitation type nomogram
- Storm Character nomogram
- Storm Category chart
- Thermogram
- Thickness comparison table
- Weather Alerts for Soundings and Cross-Sections
Soaring Data
- Trigger DALR line
- Trigger temperatures per level
- Maximum temperature DALR line
- Thermal indices per level
- Estimated lift altitude
- Estimated maximum lift altitude
- Soaring index
- CCL-based soaring index
- CCl location plot option
- Clouds depiction plot option
Note: Many of the above items are user-configurable.